TidyTuesday-Py
From the news: A series of quick charts in Python inspired by news items:
French Prime minister announces a freeze to stop further increases on regulated gas prices
Le Premier ministre a annoncé ce jeudi soir un gel des tarifs réglementés du gaz et un plafonnement à 4 % de la hausse des prix de l’électricité via une forte baisse de la fiscalité. A moins de sept mois de la présidentielle, le gouvernement dévoile ce « bouclier tarifaire » pour éviter à tout prix une crise sociale du type « gilets jaunes ».
This is the banner header from an article link here from Les Echos on 1 October 2021 announcing that Prime Minister Jean Castex announced a freeze on further natural gas price increases in France to avert a social crisis that could ignite the protests such as the gilet jaunes(yellow vests) demonstrations in 2018.
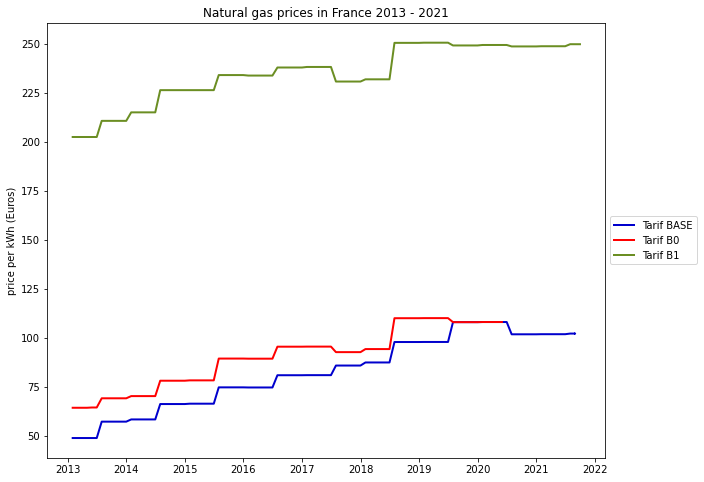
This is a look into natural gas prices in France over the past few years. I got the data for this plot from the French government open data portal(data.gouv.fr) specifically the Historique des tarifs réglementés de vente de gaz naturel pour les consommateurs résidentiels. These series of tables contains data on natural gas prices for residential customers from 2013 to 2021.
from datetime import datetime
import pandas as pd
import matplotlib.pyplot as plt

#Load files
tarifbase = pd.read_excel(r'C:\Users\warau\Documents\python_work\TidyTuesdayPy\gazfrance/tarifBase.xlsx')
tarifb0 = pd.read_excel(r'C:\Users\warau\Documents\python_work\TidyTuesdayPy\gazfrance\tarifB0.xlsx')
tarifb1 = pd.read_excel(r'C:\Users\warau\Documents\python_work\TidyTuesdayPy\gazfrance\tarifB1.xlsx')
From these data I chose to plot the following tariffs, choosing the rate that includes taxes:
The BASE tariff: concerns consumption of less than 1,000 KWh per year, which corresponds to the use of gas for cooking.
The B0 tariff : corresponds to natural gas consumption of between 1,000 and 6,000 KWh per year. This volume of consumption corresponds to the use of gas in your kitchen (cooking) and to heat your hot water (using a water heater).
The B1 tariff: this rate is for households that consume between 6,000 and 30,000 KWh of gas. This rate concerns the use of gas for cooking, hot water and heating (use of a boiler).
# multiple line plots
plt.plot( 'DATE_FIN', 'PART_FIXE_TTC', data=tarifbase, color= 'mediumblue', linewidth=2,label = "Tarif BASE")
plt.plot( 'DATE_FIN', 'PART_FIXE_TTC',data=tarifb0, color='red', linewidth=2, label = "Tarif B0")
plt.plot( 'DATE_FIN', 'PART_FIXE_TTC', data=tarifb1, color='olivedrab', linewidth=2, label = "Tarif B1")

plt.title("Natural gas prices in France 2013 - 2021")
plt.ylabel("price per kWh (Euros)")
plt.legend()

# use parameter bbox_to_anchor to reposition
# the legend box outside the plot area
plt.gca().legend(loc='center left', bbox_to_anchor=(1, 0.5))
NB: This time series data ends at different points in 2021 for each tariff, always at the end of the month: in May 2021 for Tarif B0, in Sep 2021 for Tarif B1, and in Aug 2021 for the BASE Tarif. There is a noticeable uptick in all tariffs in late 2018: