TidyTuesday-Py
From the news: new car registrations drop to a 20 year low in the United Kingdom
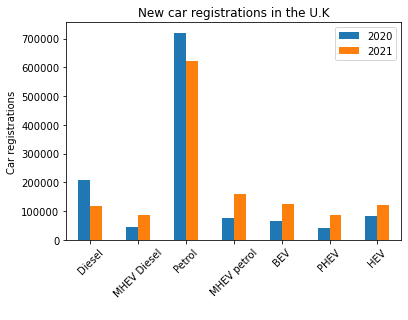
This chart was inspired by a BBC article on the drop in new car registrations in September 2021, the lowest in more than two decades. Using data from the U.K.’s Society of Motor Manufacturers and Traders I compared the registrations per year to date between last year 2020 and this year 2021.
import numpy as np
import pandas as pd
import matplotlib.pyplot as plt

UKnewcars = pd.DataFrame({
    'Model':["Diesel", "MHEV Diesel", "Petrol", "MHEV petrol","BEV", "PHEV", "HEV"],
    '2020':[209093,44351,719908,77423,66611,42483,83787],
    '2021':[117605,85171,621598,159776,125141,87040,120283]})
In the dataframe above MHEV Diesel is Mild Hybrid Electric Vehicle; BEV is Battery Electric Vehicle; HEV is Hybrid Electric Vehicle; PHEV is Plug in Electric Vehicle. For these categories of vehicles the percent change in from last September to this one is:
UKnewcars_change = UKnewcars.set_index('Model').pct_change(axis=1)*100

# displaying the results
print(UKnewcars_change.to_string(index = True))

             2020        2021
Model
Diesel        NaN  -43.754693
MHEV Diesel   NaN   92.038511
Petrol        NaN  -13.655912
MHEV petrol   NaN  106.367617
BEV           NaN   87.868370
PHEV          NaN  104.881953
HEV           NaN   43.558070
Diesel vehicle registrations saw the most decline, followed by petrol vehicles. Given the significant increases in legislation favouring electric vehicles the increases in new car purchases across all categories for electric vehicles is not surprising.